Evaluator Installation
This guide assumes Plexicus chart 1.2.8 or later and was validated end-to-end on Ubuntu 24.04.3 LTS (amd64) running k3s v1.35.4 + Helm v3.20. It produces a single-node cluster with a publicly reachable IP, suitable for proof-of-value testing on cloud or bare-metal Linux. For production deployments follow the Self-Hosted Installation guide instead.
Self-signed certificates produce browser warnings and cannot be used by webhook integrations (GitHub Apps, GitLab, Bitbucket) that require a publicly trusted certificate. Use this setup for evaluation only — not for production traffic.
What you need before you start
| Item | Minimum | Notes |
|---|---|---|
| Server OS | Ubuntu 24.04 LTS (amd64) | The recipe was validated on Noble Numbat. Any Debian-derived distro with systemd should work, but the commands and version pins below are tested only on 24.04. |
| CPU | 4 vCPU | Plexicus services + 5 prereqs comfortably fit on 4 cores during idle/eval; 2 vCPU is too tight. |
| RAM | 8 GB | Less than 8 GB will OOMKill fastapi or schedule failures on plexalyzer-*. |
| Disk | 50 GB | The chart artifacts plus Plexicus container images consume ~10 GB; persistent volumes for MongoDB / MinIO / PostgreSQL add another ~5 GB. 50 GB leaves headroom for scan workloads. |
| Network | Public IP, ports 22/80/443 reachable | k3s' built-in klipper-lb LoadBalancer assigns the node's public IP as the ingress EXTERNAL-IP, so the install procedure does not need an external load balancer or reverse proxy. |
| DNS | Two hostnames pointing at the server's public IP | Add <server-ip> plexicus.local api.plexicus.local to /etc/hosts on each evaluator's laptop (requires sudo). |
| Plexicus registry credentials | A Google Cloud service account JSON (keys.json) | Provided by Plexicus when you request evaluation access. The chart pulls all custom images from europe-west3-docker.pkg.dev using this key. Email engineering@plexicus.ai to obtain it. |
If you do not have a server yet, any cloud VM (Hetzner, DigitalOcean, AWS Lightsail, GCP small instance, …) running stock Ubuntu 24.04 will do. The numbers above are the ones the procedure was actually validated against — 4 vCPU / 7.6 GiB RAM / 150 GB disk with comfortable headroom.
Where you run each command
Two machines are involved:
- Your laptop — only used in step 5 (DNS via
/etc/hosts) and step 12 (browser-based UI flow). The/etc/hostsedit needssudo(or admin rights on Windows). On macOS/Linux:sudo nano /etc/hosts. On Windows: open Notepad as Administrator and editC:\Windows\System32\drivers\etc\hosts. - The Ubuntu server, accessed over SSH as
root(or any user with passwordlesssudo). Steps 1–11, 13, and the troubleshooting commands all run on the server. The recipe assumes the server's home directory is/root/— files likekeys.jsonandvalues-evaluator.yamllive there.
Open one SSH tab and keep it open for the whole install. A second tab is helpful for kubectl get pods --watch while the install runs.
1. Install k3s
From your laptop, SSH into the server as root (ssh root@<server-ip>). If you only have a non-root user, prefix every server command in this guide with sudo and adjust paths like /root/... to /home/<your-user>/... or run a sudo -i first to drop into root's environment. The single-line installer below pins all the choices that matter for an evaluation install:
--disable=traefik— k3s ships traefik as the default ingress controller; we disable it because the chart and its docs assume ingress-nginx as the customer-supplied ingress.--write-kubeconfig-mode=644— makes/etc/rancher/k3s/k3s.yamlreadable so subsequenthelmandkubectlcalls can read it withoutsudo.
curl -sfL https://get.k3s.io | \
  INSTALL_K3S_EXEC="--disable=traefik --write-kubeconfig-mode=644" \
  sh -
Export the kubeconfig path so helm (which does not auto-detect it) can find the cluster, and persist it for future SSH sessions:
echo 'export KUBECONFIG=/etc/rancher/k3s/k3s.yaml' >> /root/.bashrc
export KUBECONFIG=/etc/rancher/k3s/k3s.yaml
Confirm the node is Ready:
kubectl get nodes
# Expected:
# NAME          STATUS   ROLES           AGE   VERSION
# <hostname>    Ready    control-plane   30s   v1.35.4+k3s1
2. Install Helm and add chart repositories
curl -fsSL https://raw.githubusercontent.com/helm/helm/main/scripts/get-helm-3 | bash

helm repo add ingress-nginx https://kubernetes.github.io/ingress-nginx
helm repo add jetstack      https://charts.jetstack.io
helm repo add bitnami       https://charts.bitnami.com/bitnami
helm repo add temporal      https://go.temporal.io/helm-charts
helm repo update
3. Install ingress-nginx (LoadBalancer mode)
helm upgrade --install ingress-nginx ingress-nginx/ingress-nginx \
  --namespace ingress-nginx --create-namespace \
  --set controller.service.type=LoadBalancer \
  --set controller.ingressClassResource.default=true
Verify the controller picked up the public IP via k3s' built-in klipper-lb:
kubectl -n ingress-nginx get svc ingress-nginx-controller
# NAME                       TYPE           CLUSTER-IP      EXTERNAL-IP        PORT(S)                      AGE
# ingress-nginx-controller   LoadBalancer   10.43.173.102   <your-public-ip>   80:30200/TCP,443:30723/TCP   30s
4. Install cert-manager and a self-signed ClusterIssuer
helm upgrade --install cert-manager jetstack/cert-manager \
  --namespace cert-manager --create-namespace \
  --set crds.enabled=true

kubectl wait --for=condition=ready pod \
  -l app.kubernetes.io/instance=cert-manager \
  -n cert-manager --timeout=180s

kubectl apply -f - <<'EOF'
apiVersion: cert-manager.io/v1
kind: ClusterIssuer
metadata:
  name: selfsigned-issuer
spec:
  selfSigned: {}
EOF
5. Configure DNS for the two Plexicus hostnames
The chart provisions two ingress resources: plexicus.local (the frontend SPA) and api.plexicus.local (the FastAPI backend). Each evaluator's laptop needs to resolve those names to the server's public IP.
The simplest path: add a one-line entry to /etc/hosts on each evaluator's laptop (not on the server). Editing /etc/hosts requires admin rights:
- macOS / Linux:
sudo nano /etc/hosts(or your editor of choice withsudo) - Windows: open Notepad as Administrator and edit
C:\Windows\System32\drivers\etc\hosts
Append a single line, replacing <server-ip> with the actual server public IP:
<server-ip> plexicus.local api.plexicus.local
Save and verify resolution: ping plexicus.local should answer from <server-ip>.
If you prefer real DNS, configure A records plexicus.<your-domain> and api.plexicus.<your-domain> and override global.domain in the values file in step 9. The procedure is otherwise identical.
6. Create the Plexicus namespace and image-pull secret
First, copy the service-account JSON key Plexicus gave you onto the server. Run this on your laptop (not on the server):
# Replace <server-ip> with your server's public IP and adjust the local path
# to wherever you saved the key file Plexicus emailed you.
scp ~/Downloads/keys.json root@<server-ip>:/root/keys.json
If your server uses a non-default SSH key, add -i ~/.ssh/your-key. Confirm on the server: ls -l /root/keys.json should show the file with mode 600 or similar. If permissions are too open: chmod 600 /root/keys.json.
Back on the server SSH session, create the namespace and the registry pull secret:
kubectl create namespace plexicus

# /root/keys.json is the service-account JSON Plexicus provided
kubectl create secret docker-registry gar-secret \
  --docker-server=europe-west3-docker.pkg.dev \
  --docker-username=_json_key \
  --docker-password="$(cat /root/keys.json)" \
  --namespace plexicus
7. Install the five infrastructure prerequisites
By default, the Plexicus chart does not deploy MongoDB / Redis / MinIO / PostgreSQL / Temporal — install each as its own Helm release in the plexicus namespace, then point the chart at them via values-evaluator.yaml in step 9.
Bitnami moved their official chart images to a paid distribution. Free legacy images live under docker.io/bitnamilegacy/*. The commands below override every image reference (main + init + sidecar containers) accordingly. The bitnamilegacy/* images are amd64-only — perfect for this Ubuntu evaluator path.
# 1. MongoDB
helm upgrade --install mongodb bitnami/mongodb --version 18.6.15 -n plexicus \
  --set global.security.allowInsecureImages=true \
  --set image.repository=bitnamilegacy/mongodb \
  --set defaultInitContainers.volumePermissions.image.repository=bitnamilegacy/os-shell \
  --set metrics.image.repository=bitnamilegacy/mongodb-exporter \
  --set 'auth.rootPassword=<choose-a-strong-mongo-root-password>' \
  --set 'auth.databases={plexicus}' \
  --set 'auth.usernames={plexicus}' \
  --set 'auth.passwords={<choose-a-plexicus-db-password>}' \
  --set persistence.size=4Gi --wait

# 2. Redis
helm upgrade --install redis bitnami/redis --version 25.3.2 -n plexicus \
  --set global.security.allowInsecureImages=true \
  --set image.repository=bitnamilegacy/redis \
  --set sentinel.image.repository=bitnamilegacy/redis-sentinel \
  --set metrics.image.repository=bitnamilegacy/redis-exporter \
  --set kubectl.image.repository=bitnamilegacy/kubectl \
  --set defaultInitContainers.volumePermissions.image.repository=bitnamilegacy/os-shell \
  --set sysctl.image.repository=bitnamilegacy/os-shell \
  --set auth.password=<choose-a-redis-password> \
  --set replica.replicaCount=0 \
  --set master.persistence.size=2Gi --wait

# 3. MinIO
helm upgrade --install minio bitnami/minio --version 17.0.21 -n plexicus \
  --set global.security.allowInsecureImages=true \
  --set image.repository=bitnamilegacy/minio \
  --set defaultInitContainers.volumePermissions.image.repository=bitnamilegacy/os-shell \
  --set console.image.repository=bitnamilegacy/minio-object-browser \
  --set apiIngress.enabled=false --set ingress.enabled=false \
  --set auth.rootUser=minioadmin \
  --set auth.rootPassword=<choose-a-minio-password> \
  --set defaultBuckets=platform \
  --set persistence.size=2Gi --wait

# 4. PostgreSQL (used by Temporal)
helm upgrade --install temporal-postgresql bitnami/postgresql --version 18.5.6 -n plexicus \
  --set global.security.allowInsecureImages=true \
  --set image.repository=bitnamilegacy/postgresql \
  --set metrics.image.repository=bitnamilegacy/postgres-exporter \
  --set defaultInitContainers.volumePermissions.image.repository=bitnamilegacy/os-shell \
  --set auth.postgresPassword=<choose-a-temporal-pg-password> \
  --set primary.persistence.size=2Gi --wait

# 5. Temporal — the Helm install does not pass --wait because the
# server pods crash-loop briefly while the schema-setup Job runs.
helm upgrade --install temporal temporal/temporal --version 0.73.2 -n plexicus \
  --set server.replicaCount=1 \
  --set cassandra.enabled=false --set elasticsearch.enabled=false \
  --set prometheus.enabled=false --set grafana.enabled=false \
  --set server.config.persistence.default.driver=sql \
  --set server.config.persistence.default.sql.driver=postgres12 \
  --set server.config.persistence.default.sql.host=temporal-postgresql \
  --set server.config.persistence.default.sql.port=5432 \
  --set server.config.persistence.default.sql.database=temporal \
  --set server.config.persistence.default.sql.user=postgres \
  --set server.config.persistence.default.sql.password=<the-temporal-pg-password-from-step-4> \
  --set server.config.persistence.visibility.driver=sql \
  --set server.config.persistence.visibility.sql.driver=postgres12 \
  --set server.config.persistence.visibility.sql.host=temporal-postgresql \
  --set server.config.persistence.visibility.sql.port=5432 \
  --set server.config.persistence.visibility.sql.database=temporal_visibility \
  --set server.config.persistence.visibility.sql.user=postgres \
  --set server.config.persistence.visibility.sql.password=<the-temporal-pg-password-from-step-4>
Wait until every prerequisite pod reaches Running (Temporal needs ~2 min while the schema bootstrap completes):
kubectl -n plexicus get pods --watch
You should end up with eight 1/1 Running pods and one Completed schema-setup Job.
Once all Temporal pods are Running, register the default namespace. Login returns HTTP 500 "Namespace default is not found" until this step is complete:
kubectl -n plexicus exec deploy/temporal-admintools -- \
  tctl --address temporal-frontend:7233 namespace register default
# Namespace default successfully registered.
8. Create the per-service application secrets
Plexicus services read sensitive values (passwords, OAuth client secrets, AI-piloting keys, etc.) from Kubernetes Secrets through the existingSecret pattern. Create one Secret per service before installing the chart.
The full key catalog per service is in the chart-bundled docs/secrets-management.md (extract via helm pull oci://… --untar). For an evaluation install the eight commands below are sufficient — replace each <…> placeholder.
The MongoDB password you set in plexicus-fastapi, plexicus-worker, plexicus-analysis-scheduler, plexicus-codex-remedium, and plexicus-exporter MUST match the auth.rootPassword you used in step 7's mongodb install. Mismatches surface as MongoDB Authentication failed in fastapi logs.
When you choose DB_PASS, REDIS_PASS, and MINIO_PASS, use only letters and digits (e.g. openssl rand -hex 24). pymongo refuses to URL-encode special characters (@, :, /, ?, #, %, !, $) in connection URIs and will fail with Username and password must be escaped according to RFC 3986. Redis and MinIO have similar quoting traps in their clients.
OPENAI_API_KEY='<your-openai-or-deepseek-or-azure-openai-key>'
GITHUB_SECRET='<your-github-oauth-client-secret>'
GH_APP_PRIVATE_KEY='<your-github-app-private-key-pem>'

# Use the SAME values you supplied in step 7 — they are not secrets the
# chart generates, they are the credentials your prereq Helm releases use.
DB_PASS='<the-mongo-root-password-from-step-7>'
REDIS_PASS='<the-redis-password-from-step-7>'
MINIO_PASS='<the-minio-password-from-step-7>'

# Generate one-off random values for everything else
SECRET_KEY=$(openssl rand -hex 32)
PLEXALYZER_SECRET=$(openssl rand -hex 32)
NUXT_SECRET=$(openssl rand -hex 32)
# SSO / SAML / OIDC keys (chart 1.2.7+) — populate even if you don't use SSO
# in the eval install; the SAML/OIDC handlers fall back to fail-closed if
# these are unset, which surfaces as confusing 500s on a half-configured
# install.
BREAK_GLASS=$(openssl rand -hex 32)
SSO_RELAY=$(openssl rand -hex 32)
SSO_ENCRYPT=$(openssl rand -hex 32)

kubectl -n plexicus create secret generic plexicus-fastapi \
  --from-literal=DATABASE_PASSWORD="$DB_PASS" \
  --from-literal=REDIS_PASSWORD="$REDIS_PASS" \
  --from-literal=SECRET_KEY="$SECRET_KEY" \
  --from-literal=PLEXALYZER_SECRET_KEY="$PLEXALYZER_SECRET" \
  --from-literal=GH_APP_PRIVATE_KEY="$GH_APP_PRIVATE_KEY" \
  --from-literal=GITHUB_CLIENT_SECRET="$GITHUB_SECRET" \
  --from-literal=GITLAB_CLIENT_SECRET="" \
  --from-literal=BITBUCKET_CLIENT_SECRET="" \
  --from-literal=BITBUCKET_ACCESS_TOKEN="" \
  --from-literal=MINIO_ROOT_PASSWORD="$MINIO_PASS" \
  --from-literal=SMTP_PASSWORD="" \
  --from-literal=BREAK_GLASS_SECRET_KEY="$BREAK_GLASS" \
  --from-literal=SSO_RELAY_STATE_SECRET="$SSO_RELAY" \
  --from-literal=SSO_ENCRYPTION_KEY="$SSO_ENCRYPT" \
  --from-literal=DEPLOYMENT_MANAGER_OPENAI_API_KEY_FREE="$OPENAI_API_KEY" \
  --from-literal=SWE_OPENAI_API_KEY="$OPENAI_API_KEY" \
  --from-literal=STRIPE_API_KEY="" \
  --from-literal=STRIPE_WEBHOOK_SECRET="" \
  --from-literal=CANNY_PRIVATE_TOKEN="" \
  --from-literal=POSTHOG_API_KEY="" \
  --from-literal=POSTHOG_PERSONAL_API_KEY="" \
  --from-literal=MAUTIC_AUTH="" \
  --from-literal=MICROSOFT_MARKETPLACE_CLIENT_SECRET="" \
  --from-literal=MICROSOFT_INSTRUMENTATION_KEY=""

kubectl -n plexicus create secret generic plexicus-worker \
  --from-literal=DATABASE_PASSWORD="$DB_PASS" \
  --from-literal=REDIS_PASSWORD="$REDIS_PASS" \
  --from-literal=SECRET_KEY="$SECRET_KEY" \
  --from-literal=PLEXALYZER_SECRET_KEY="$PLEXALYZER_SECRET" \
  --from-literal=GH_APP_PRIVATE_KEY="$GH_APP_PRIVATE_KEY" \
  --from-literal=MINIO_ROOT_PASSWORD="$MINIO_PASS" \
  --from-literal=PLEXALYZER_TOKEN="$PLEXALYZER_SECRET" \
  --from-literal=AZURE_RESOURCE_PASSWORD="" \
  --from-literal=AZURE_RESOURCE_USERNAME=""

kubectl -n plexicus create secret generic plexicus-frontend \
  --from-literal=NUXT_SECRET_KEY="$NUXT_SECRET" \
  --from-literal=NUXT_GITHUB_SECRET_KEY="$GITHUB_SECRET" \
  --from-literal=NUXT_GITLAB_SECRET_KEY="" \
  --from-literal=NUXT_BITBUCKET_CLOUD_SECRET="" \
  --from-literal=NUXT_GOOGLE_CLIENT_SECRET="" \
  --from-literal=NUXT_STRIPE_KEY="" \
  --from-literal=NUXT_PILOTING_KEY="" \
  --from-literal=NUXT_PILOTING_REMEDIATOR_KEY="" \
  --from-literal=NUXT_TURNSTILE_SECRET_KEY="1x0000000000000000000000000000000AA"
# ^ Cloudflare's "always passes" test secret. Chart 1.2.7+ wires this
#   default automatically via frontend.envs.NUXT_TURNSTILE_SECRET_KEY,
#   so this Secret entry is redundant — but kept here as a safety net for
#   downstream charts that strip the env. For PRODUCTION, set your real
#   Cloudflare secret in your values overlay
#   (global.required.turnstile.secretKey) — values in the existingSecret
#   are ignored because env: takes precedence over envFrom:.

kubectl -n plexicus create secret generic plexicus-analysis-scheduler \
  --from-literal=DATABASE_PASSWORD="$DB_PASS"

kubectl -n plexicus create secret generic plexicus-codex-remedium \
  --from-literal=DATABASE_PASSWORD="$DB_PASS" \
  --from-literal=REDIS_PASSWORD="$REDIS_PASS" \
  --from-literal=PLEXALYZER_SECRET_KEY="$PLEXALYZER_SECRET"

kubectl -n plexicus create secret generic plexicus-exporter \
  --from-literal=DATABASE_PASSWORD="$DB_PASS" \
  --from-literal=OPENAI_API_KEY="$OPENAI_API_KEY"

kubectl -n plexicus create secret generic plexicus-plexalyzer-code \
  --from-literal=PLEXALYZER_SECRET_KEY="$PLEXALYZER_SECRET" \
  --from-literal=NVD_API_KEY=""

kubectl -n plexicus create secret generic plexicus-plexalyzer-prov \
  --from-literal=PLEXALYZER_SECRET_KEY="$PLEXALYZER_SECRET"
The empty values are fine for an evaluation install; features that depend on them (GitHub OAuth scanning, AI remediation, transactional email) will be unavailable until you fill them in.
9. Prepare the Plexicus values overlay
Save the following as /root/values-evaluator.yaml. This is a minimal overlay — it only sets values that differ from the chart's built-in global.required.* defaults, plus a small set of new environment variables not yet wired into the chart. Infrastructure connection strings (database host, Redis, MinIO, Temporal endpoints, Turnstile test tokens) are already provided by chart 1.2.7+ defaults and do not need to be repeated here.
global:
  domain: plexicus.local
  scheme: "https"
  wsScheme: "wss"
  ingressClassName: "nginx"
  certManager:
    enabled: true
    clusterIssuer: "selfsigned-issuer"
  imagePullSecrets:
    - name: gar-secret

  required:
    # Only the *passwords* differ from the chart defaults — the host names
    # (mongodb / redis-master / minio:9000 / etc.) match what step 7 produced.
    database:
      password: "<the-mongo-root-password-from-step-7>"
    redis:
      password: "<the-redis-password-from-step-7>"
    minio:
      rootPassword: "<the-minio-password-from-step-7>"
    postgresql:
      password: "<the-temporal-pg-password-from-step-7>"

    # AI piloting keys — required for the worker's AI enrichment pipeline.
    # Without these, scans hang at "Scanning in progress" with worker logs
    # showing `openai.OpenAIError: The api_key client option must be set`.
    # Reuse your OpenAI / DeepSeek / Azure OpenAI key for both values in eval.
    ai:
      openAiKeyFree: &oaiKeyFree "<to-fill>"
      openAiKeySwe: &oaiKeySwe "<to-fill>"

    # Turnstile defaults to Cloudflare test tokens (chart 1.2.7+) — eval-friendly
    # out of the box. PRODUCTION DEPLOYMENTS MUST OVERRIDE both siteKey AND
    # secretKey with real keys from dash.cloudflare.com, otherwise the
    # bot-protection layer is effectively disabled.
    # Uncomment + replace for production:
    # turnstile:
    #   siteKey: "0x4AAAAAAA…YOUR-SITEKEY"
    #   secretKey: "0x4AAAAAAA…YOUR-SERVER-SECRET"

fastapi:
  existingSecret: plexicus-fastapi
  envs:
    # New envs not yet wired into chart values.yaml
    OAUTHLIB_INSECURE_TRANSPORT: "0"
    WEBAUTHN_RP_ID: "plexicus.local"
    WEBAUTHN_ORIGIN: "https://plexicus.local"
    SKIP_EMAIL_VERIFICATION: "true"
  ingress:
    enabled: true
    hosts:
      - host: api.plexicus.local
        paths:
          - {path: /, pathType: Prefix}
    tls:
      - secretName: plexicus-fastapi-tls
        hosts: [api.plexicus.local]

frontend:
  existingSecret: plexicus-frontend
  # Nuxt SSR renders pages server-side and fetches https://api.plexicus.local/...
  # from inside the pod. The cluster's DNS can't resolve `api.plexicus.local`
  # (that name only exists in your laptop's /etc/hosts), so SSR fetches fail
  # and pages render empty/broken. hostAliases adds /etc/hosts entries
  # *inside the pod* so the SSR request resolves to your ingress LB.
  # Replace <server-ip> with the EXTERNAL-IP shown by:
  #   kubectl -n ingress-nginx get svc ingress-nginx-controller
  hostAliases:
    - ip: "<server-ip>"
      hostnames: [api.plexicus.local]
  ingress:
    enabled: true
    hosts:
      - host: plexicus.local
        paths:
          - {path: /, pathType: Prefix}
    tls:
      - secretName: plexicus-frontend-tls
        hosts: [plexicus.local]

worker:
  existingSecret: plexicus-worker

analysis-scheduler:
  existingSecret: plexicus-analysis-scheduler
  replicaCount: 0

exporter:
  existingSecret: plexicus-exporter
  replicaCount: 0

plexalyzer-code:
  existingSecret: plexicus-plexalyzer-code
  replicaCount: 0

plexalyzer-prov:
  existingSecret: plexicus-plexalyzer-prov
  replicaCount: 0
10. Install the Plexicus chart
Pull the chart from the OCI registry — the credentials Plexicus provided also authenticate Helm:
cat /root/keys.json | helm registry login \
  europe-west3-docker.pkg.dev \
  --username _json_key \
  --password-stdin

export CHART_VERSION=1.2.8   # ask engineering@plexicus.ai for the latest published version

helm upgrade --install plexicus \
  oci://europe-west3-docker.pkg.dev/plexicus-registry/charts/plexicus \
  --version $CHART_VERSION \
  --namespace plexicus \
  -f /root/values-evaluator.yaml
Watch pods come up:
kubectl -n plexicus get pods -w
Within 3–5 minutes fastapi, frontend, and worker should be 1/1 Running. The temporal-frontend / history / matching / worker pods restart 3–5 times during the initial schema bootstrap — this is expected.
Verify the TLS certificates were issued and the ingresses are bound:
kubectl -n plexicus get certificate
# NAME                    READY   SECRET                  AGE
# plexicus-fastapi-tls    True    plexicus-fastapi-tls    2m
# plexicus-frontend-tls   True    plexicus-frontend-tls   2m

kubectl -n plexicus get ingress
# NAME       CLASS   HOSTS                ADDRESS            PORTS     AGE
# fastapi    nginx   api.plexicus.local   <your-public-ip>   80, 443   2m
# frontend   nginx   plexicus.local       <your-public-ip>   80, 443   2m
A first end-to-end smoke test from the server itself:
curl -k -s -o /dev/null -w "Frontend  %{http_code}\n" -H "Host: plexicus.local"     https://localhost
curl -k -s -o /dev/null -w "API/health %{http_code}\n" -H "Host: api.plexicus.local" https://localhost/health
# Frontend  302         (the SPA's login redirect)
# API/health 200        (FastAPI is reading from MongoDB / Redis / MinIO / Temporal)
11. Create the first admin user
Open https://plexicus.local in your browser. Accept the self-signed certificate warning (Chrome: type thisisunsafe on the warning page; Firefox / Safari: Advanced → Proceed), then do the same on https://api.plexicus.local/health so the SPA can reach the API.
Click Register, fill in the form (password needs an uppercase, lowercase, digit, and special character — e.g. ChangeMeNow1!), and submit. The first user is automatically promoted to admin and can log in immediately.
The values overlay in step 9 sets SKIP_EMAIL_VERIFICATION="true" so new accounts skip the email-verification step. Do not use this in production — wire real SMTP credentials into plexicus-fastapi (SMTP_PASSWORD) and drop the env from your overlay so the standard verification flow runs.
12. First scan — sandbox path (no OAuth required)
For a first walk-through, the Sandbox onboarding flow is the fastest way to see Plexicus end-to-end: it uses a pre-configured vulnerable repository (simplest-vulnerable) and a synthetic SCM connector, so you do not need to register an OAuth app at GitHub / GitLab / Bitbucket. The full flow takes about 3–5 minutes (1 minute clicking through, 2–4 minutes waiting for the scan).
For the production path with real GitHub / GitLab / Bitbucket OAuth, see §12.alt — Connect a real SCM below.
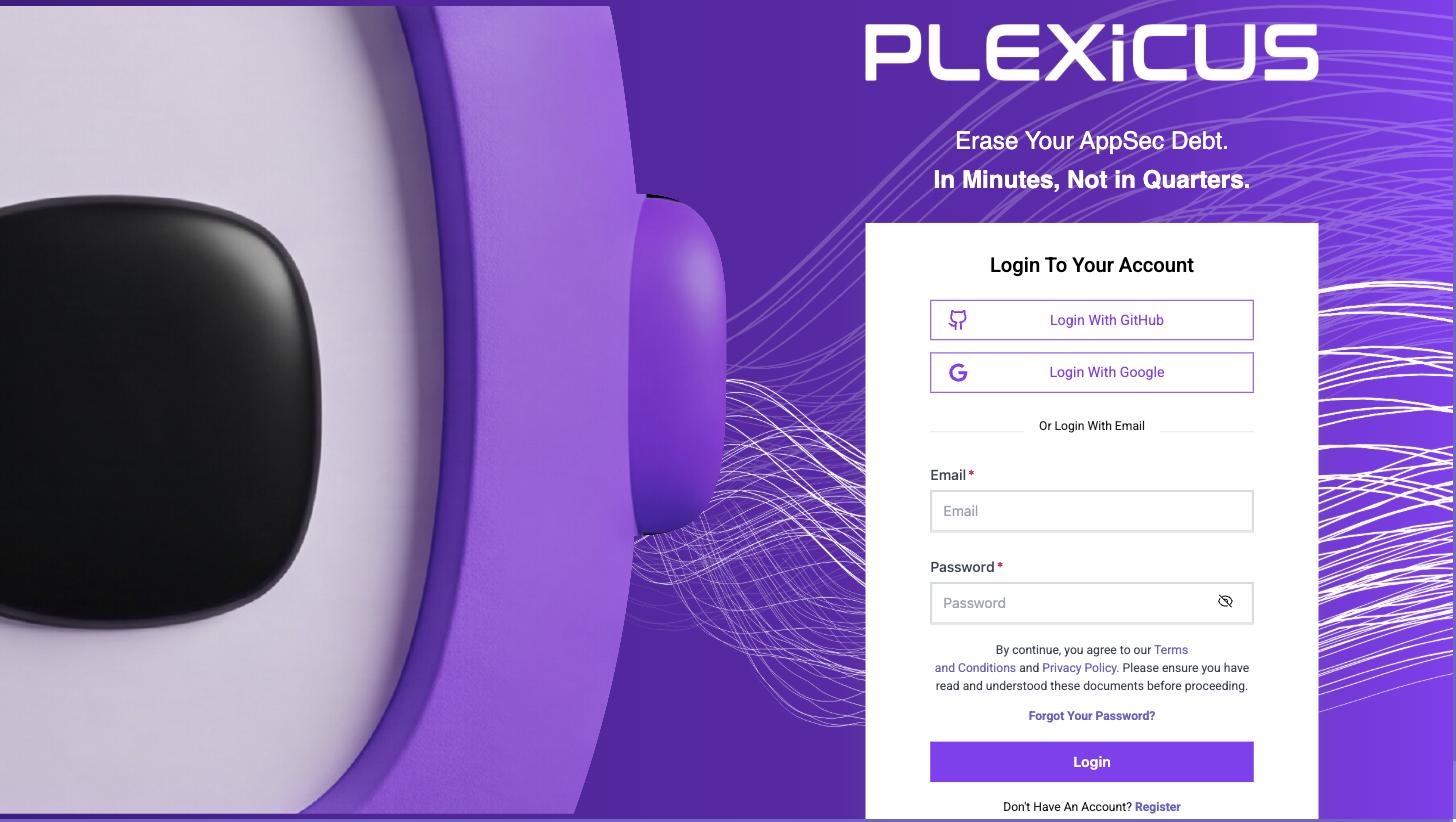
12.1 Sign in to the panel
Sign in at https://plexicus.local with the credentials you registered in step 11.
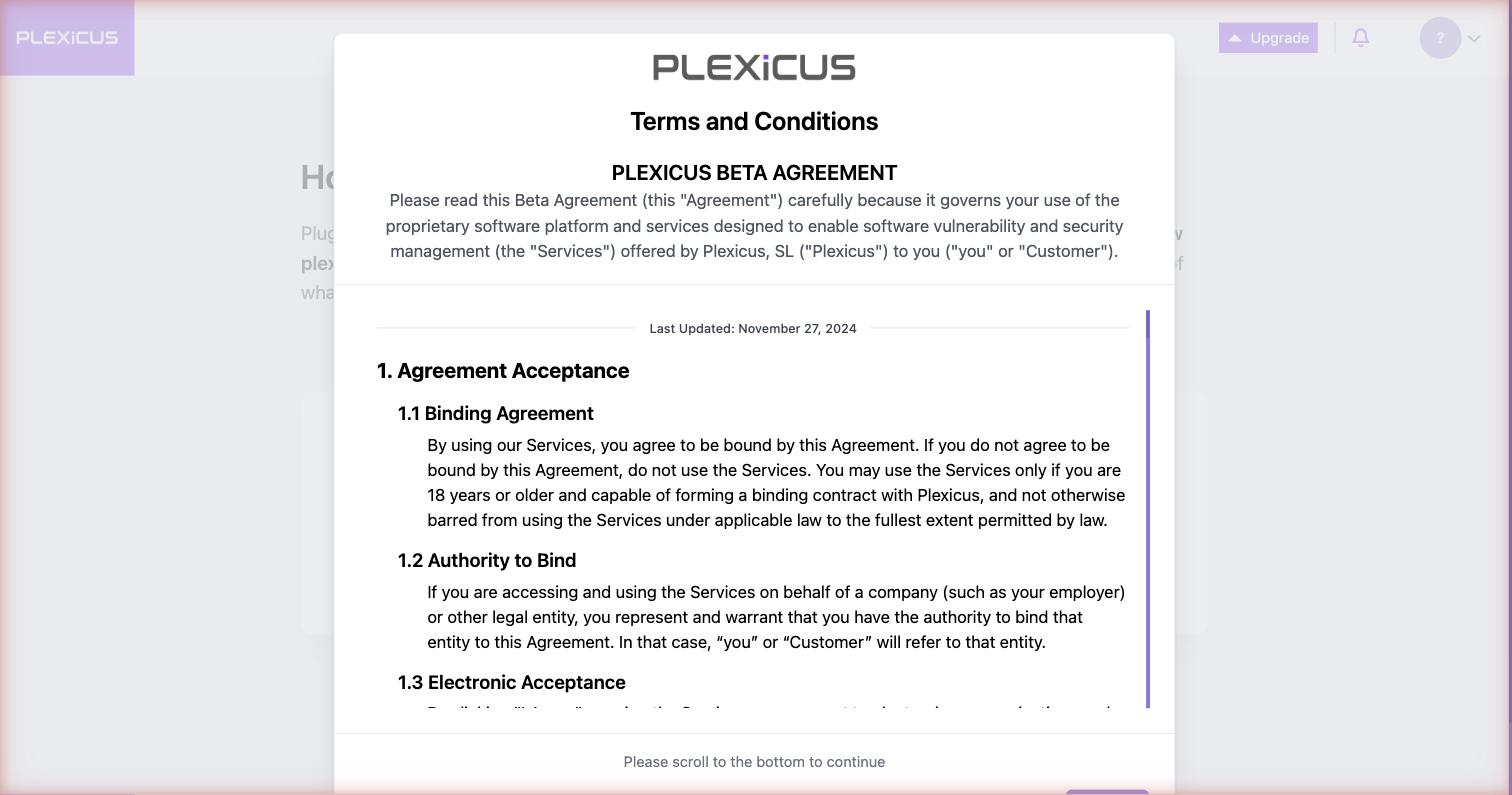
12.2 Accept the Beta Agreement
The first time you log in, a modal asks you to read and accept the Plexicus Beta Agreement. Scroll the modal to the bottom, then click Continue (the button is disabled until the scrollbar reaches the bottom).
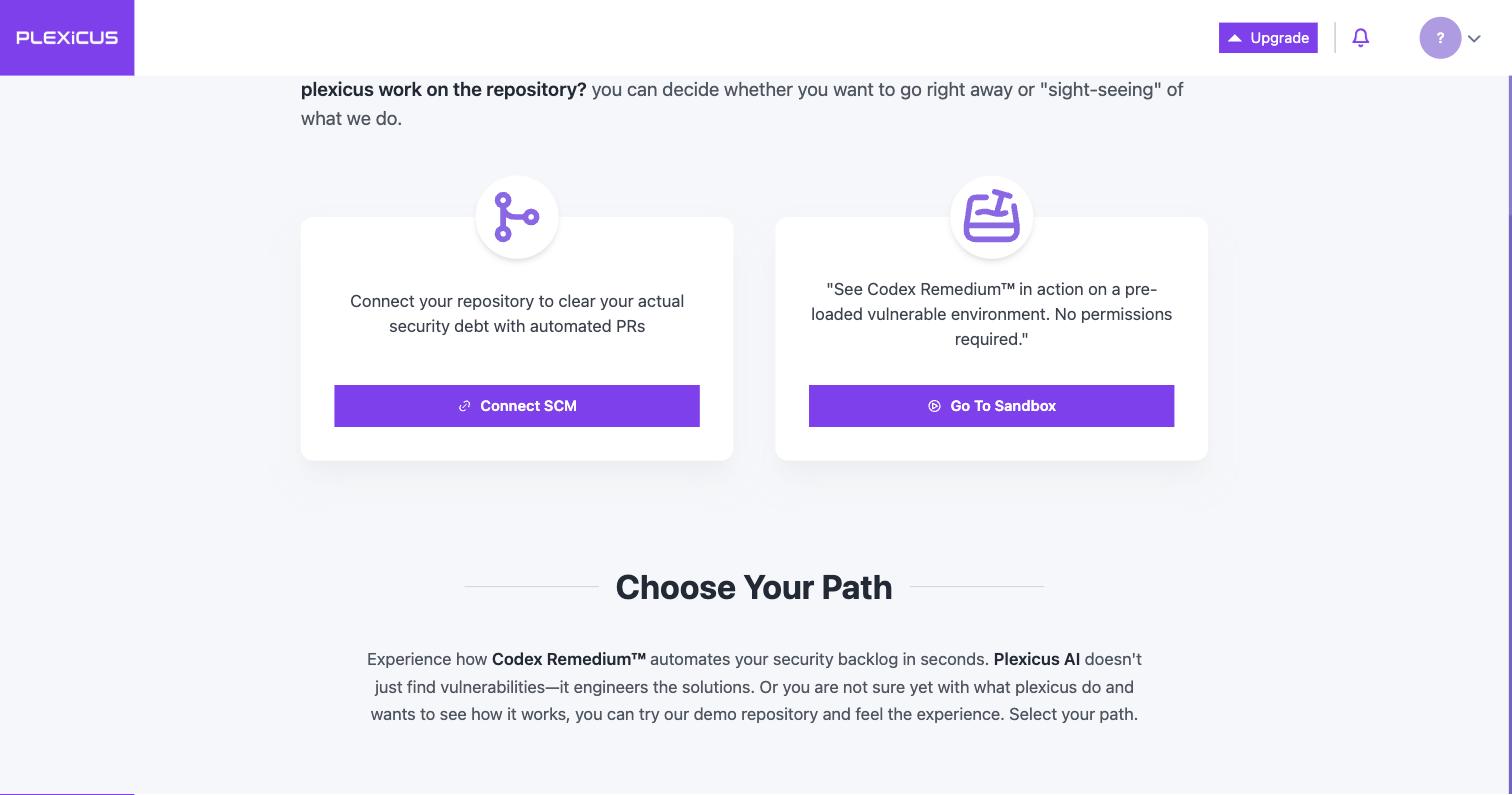
12.3 Choose your onboarding path
Onboarding offers two paths: Connect SCM (production — real OAuth) or Go To Sandbox (eval — synthetic repo, instant scan). Click Go To Sandbox.
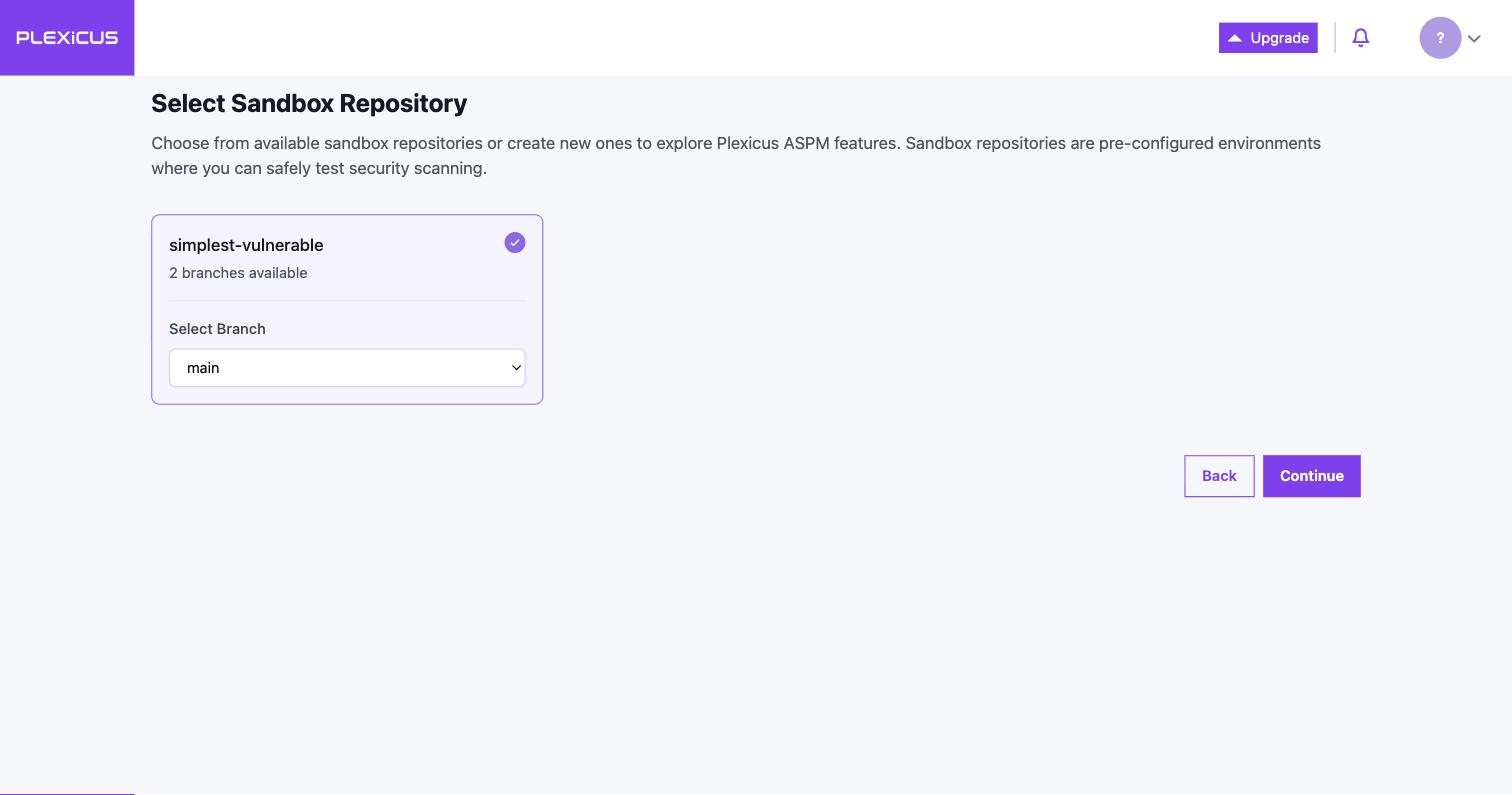
12.4 Select the sandbox repository
The sandbox catalogue lists a single pre-configured target — simplest-vulnerable — with two branches available. Click the card to select it.
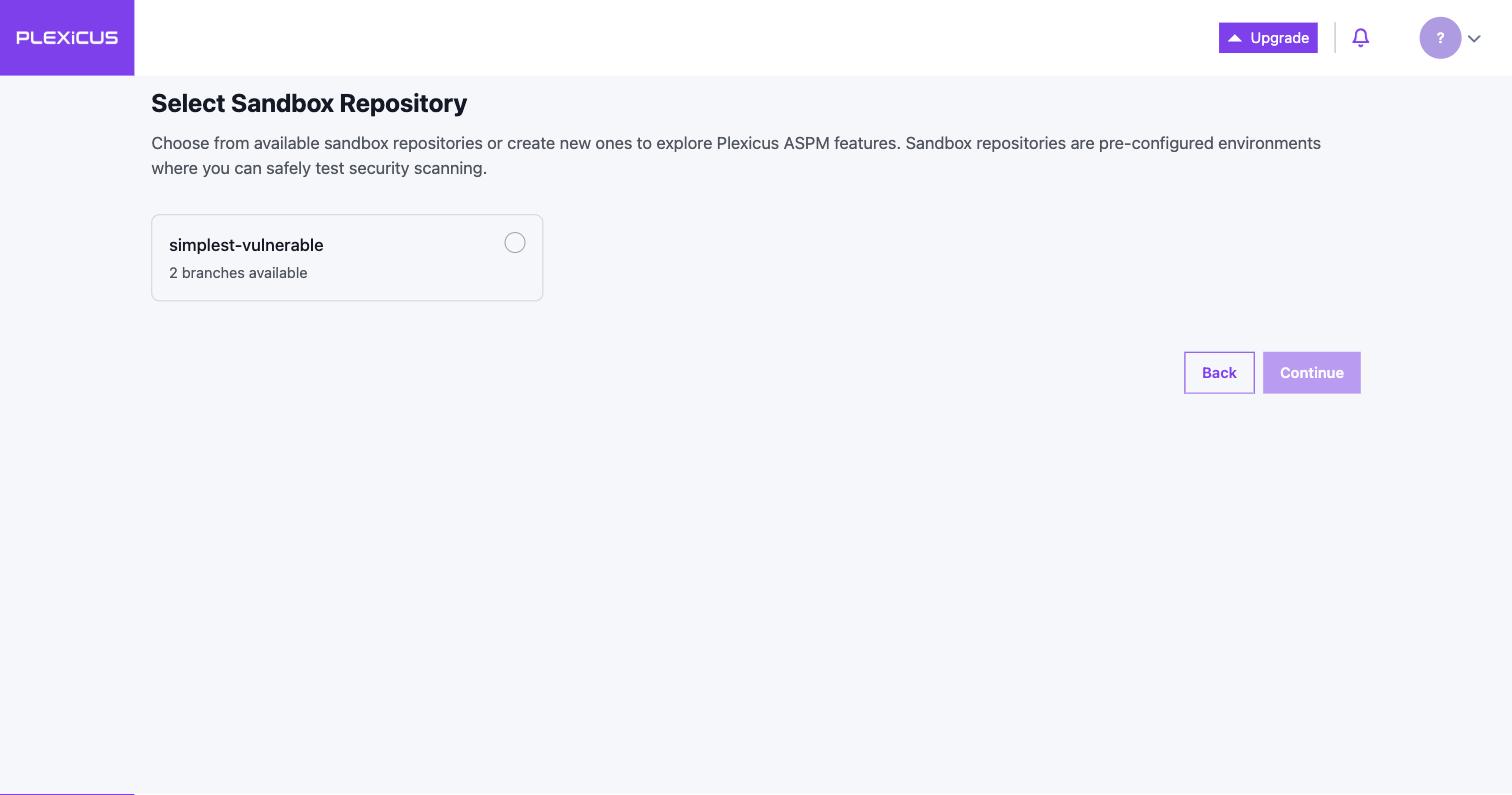
The branch dropdown defaults to main. Confirm and click Continue.
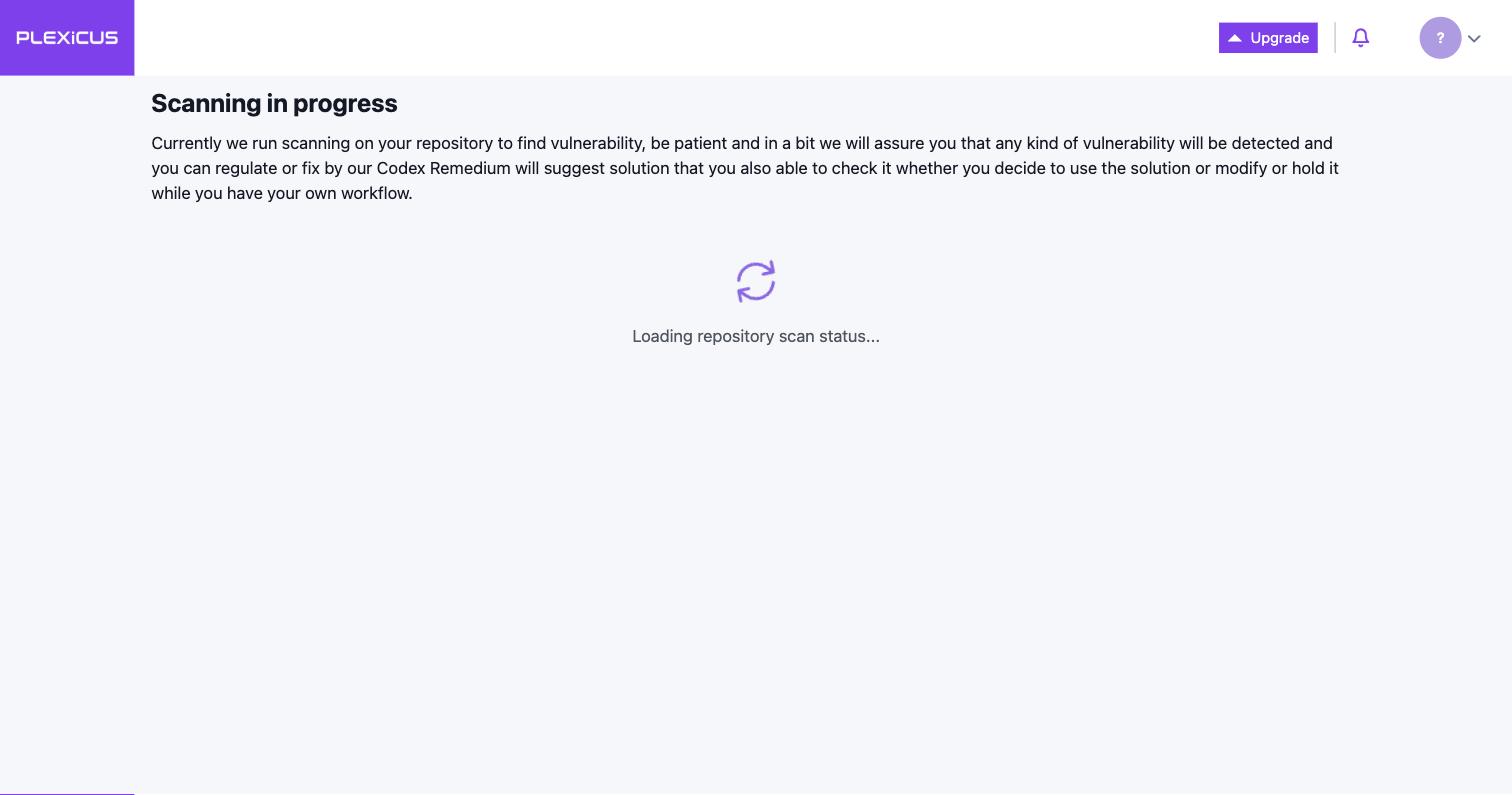
12.5 Wait for the scan
Plexicus shows the Scanning in progress screen while the worker pipeline (clone → SAST → SCA → enrichment) runs. Expect ~2 minutes for the sandbox repo, longer for real repositories.
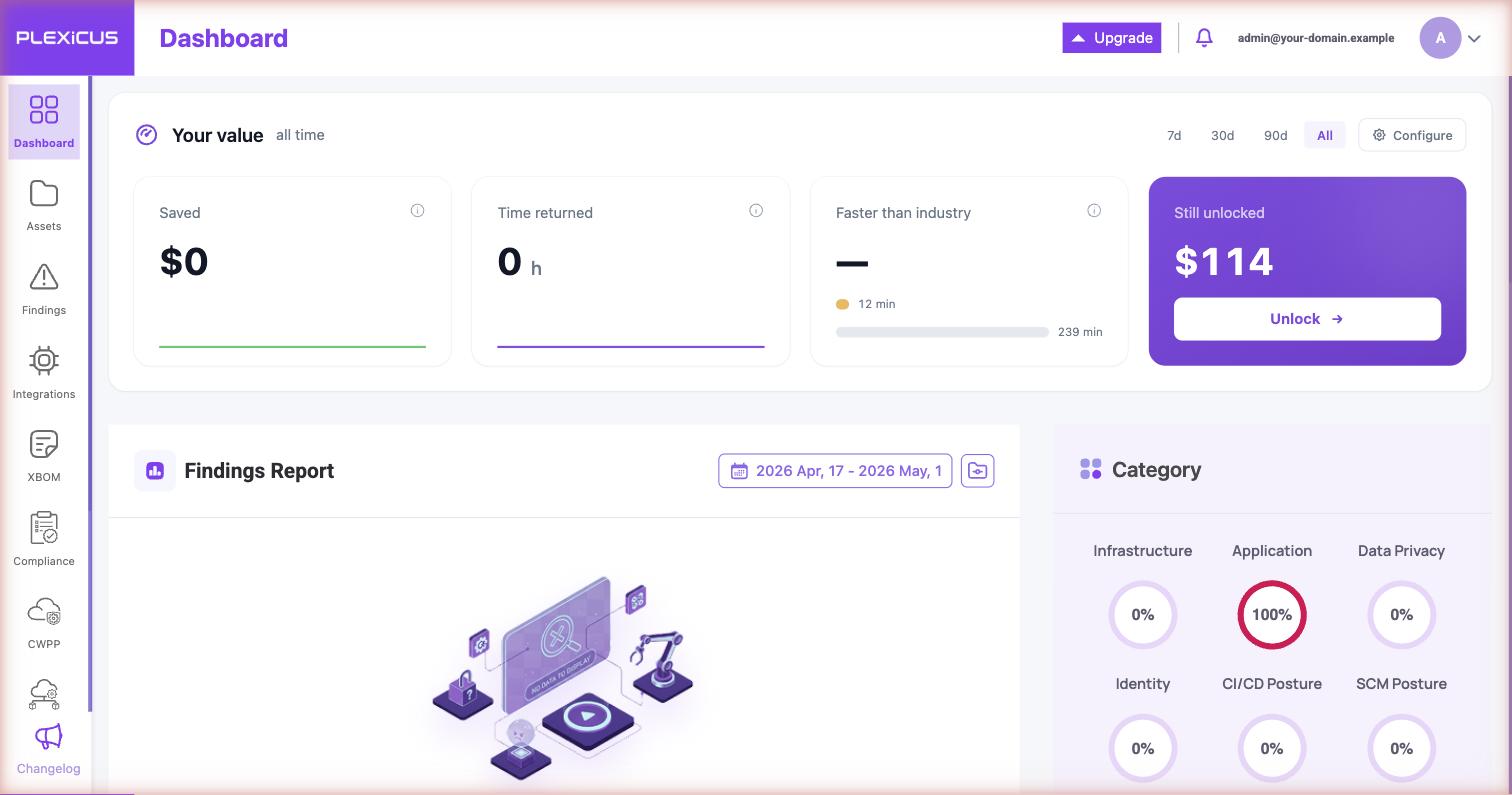
12.6 Land on the Dashboard
After the scan completes Plexicus drops you on the Dashboard. It summarises the value the platform claims to have unlocked (saved cost, returned engineering time, comparison vs industry baseline) and reserves the bottom panels for findings reports once data accumulates.
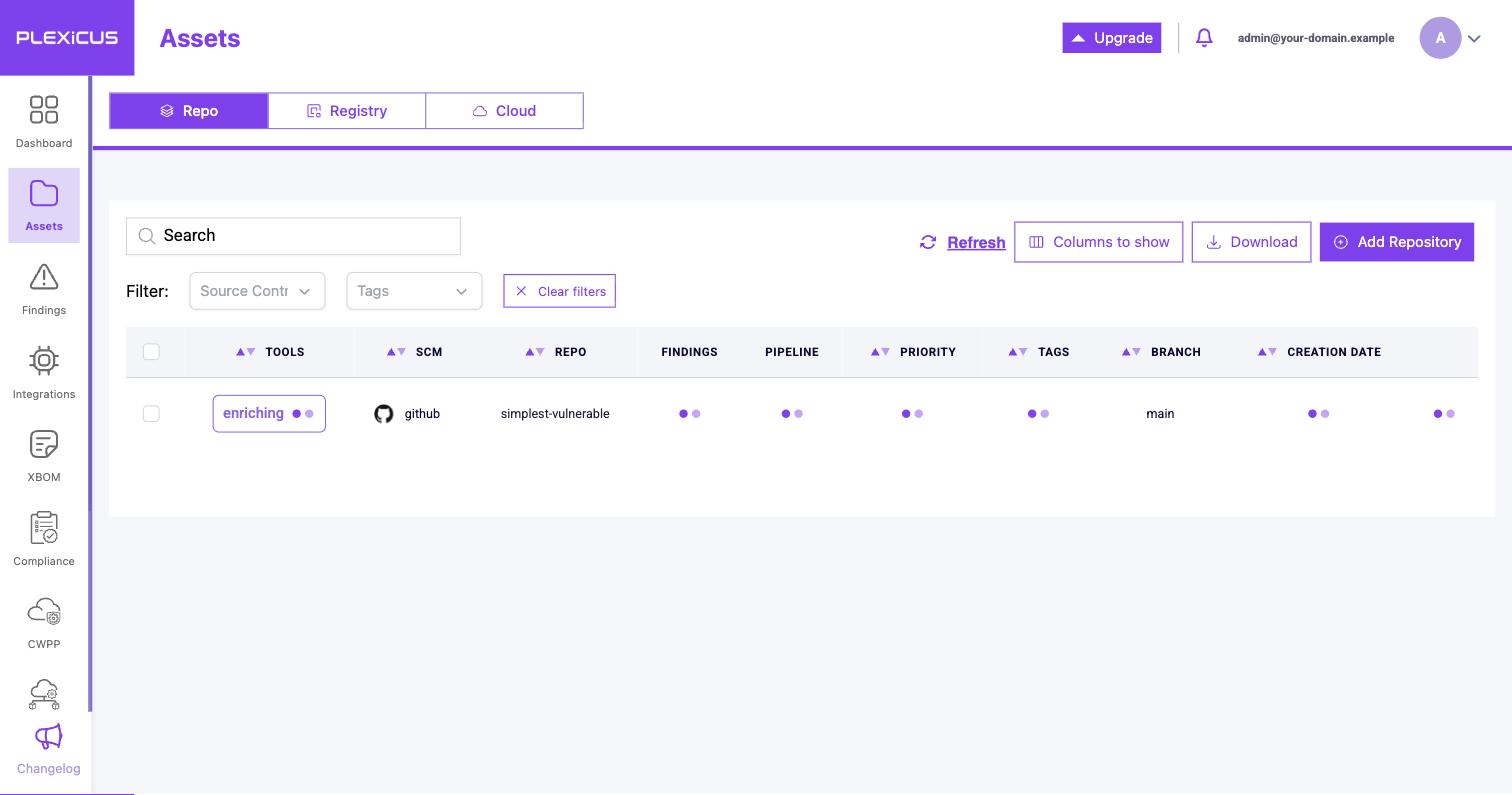
12.7 Review the repository in Assets
Open Assets in the left sidebar. The sandbox repository (simplest-vulnerable) appears with a TOOLS badge that shows the scanner state — enriching while the AI piloting service is still annotating findings, then transitioning to the final scanned state. The FINDINGS, PIPELINE, PRIORITY, and TAGS columns populate as enrichment completes.
12.8 Open the Findings page
Open Findings in the left sidebar. The page is split into Repo / SCM / Cloud / Registry tabs (Repo is the default). The first time you land here on a brand-new install you'll often see the "Zero findings remaining" empty state — every finding the scanner produced has been auto-resolved or is still in the enriched state until you take an action on it.
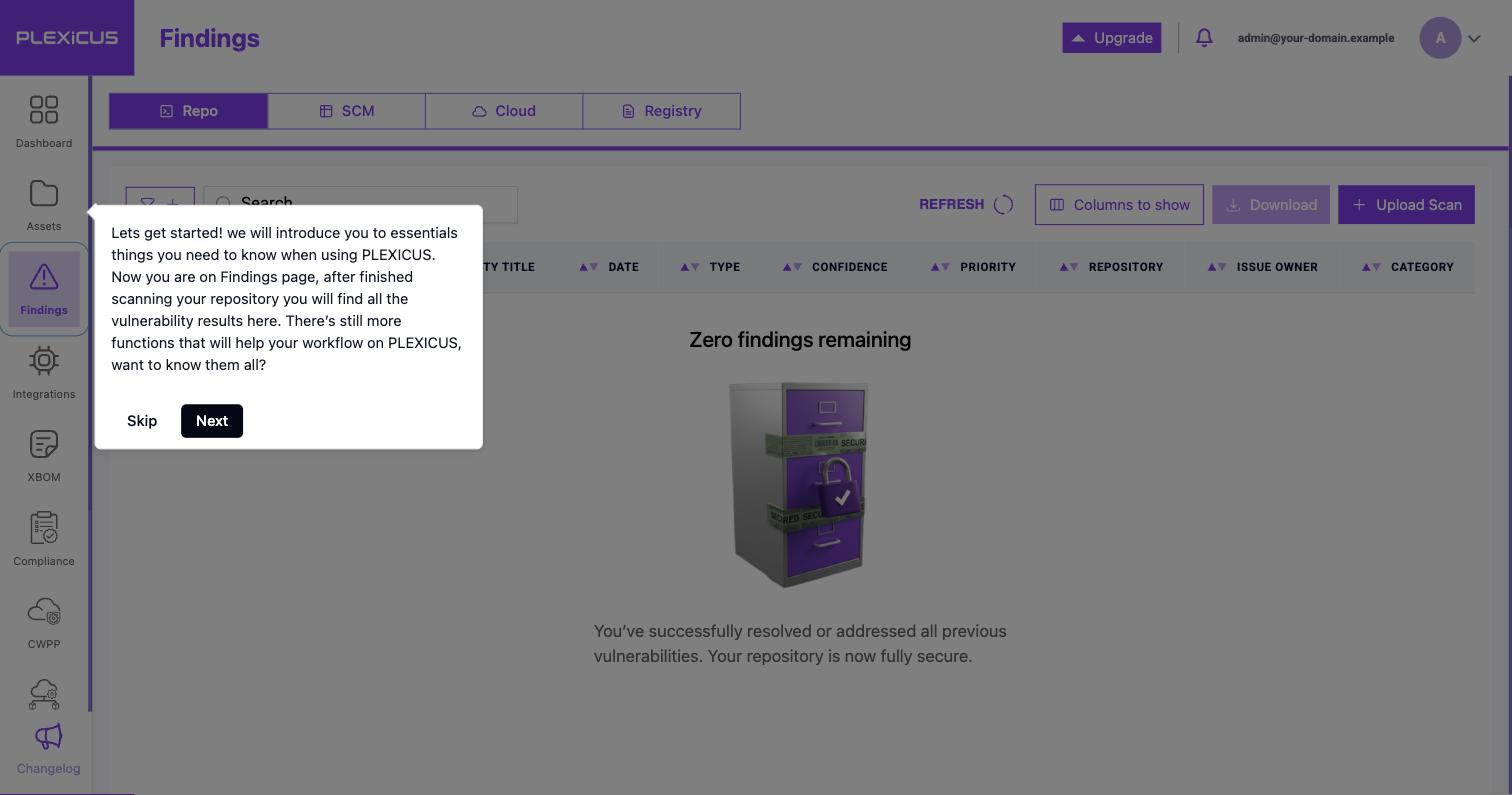
To bring findings into the visible list, apply a filter (the funnel icon next to the Search box) that includes statuses like enriched and completed, or drill into the repository directly from the Assets page (12.7). For sandbox installs, the empty state itself is the proof that the full pipeline (clone → SAST → SCA → enrichment) ran end-to-end without erroring.
12.alt Why the eval install does not need real OAuth
The Sandbox path documented above bypasses the OAuth flow entirely — Plexicus serves a synthetic SCM connector backed by the pre-loaded simplest-vulnerable repository, so the install reaches Findings without ever round-tripping through GitHub/GitLab/Bitbucket. That is fine for evaluation because the chart's defaults leave every OAuth clientId empty (the SPA detects the empty value and disables the Login with GitHub / Connect button rather than starting a redirect that would 404).
For a production install with real repositories, you need an OAuth application registered on the provider side with a callback URL that exactly matches what Plexicus sends — otherwise GitHub returns redirect_uri_mismatch and refuses the request. The eval host (plexicus.local) is on /etc/hosts, not on public DNS, so registering an OAuth app for it would fail anyway.
For step-by-step OAuth-app registration (GitHub / GitLab / Bitbucket / Google), see the production guide:
- Production path — register OAuth apps first
- Subsections: GitHub · GitLab · Bitbucket · Wire credentials into Plexicus
Once a SCM is connected via the browser, the same operations are available over the REST API for CI / scripting use cases (POST /create_repository_with_list, POST /request_repo_scan, GET /findings).
13. Cleanup
Removing the entire evaluation stack:
helm -n plexicus uninstall plexicus
helm -n plexicus uninstall mongodb redis minio temporal-postgresql temporal
# PVCs are NOT deleted by uninstall — drop them too if you want a fully
# clean slate (otherwise re-installing with a different MongoDB password
# will fail because the data volume retains the old auth state).
kubectl -n plexicus delete pvc --all
kubectl delete namespace plexicus
helm -n cert-manager uninstall cert-manager
helm -n ingress-nginx uninstall ingress-nginx
To remove k3s entirely:
/usr/local/bin/k3s-uninstall.sh
Troubleshooting
Pods stuck in Init:0/1 (wait-for-dependencies)
The wait-for-dependencies initContainer probes redis-master:6379 and temporal-frontend:7233. If the prereq Helm releases are not yet Healthy, or you are using externally-managed Redis / Temporal at different service names, override global.dependencies.* in the values overlay.
pymongo.errors.InvalidURI: MongoDB URI options are key=value pairs.
Symptom: every Plexicus pod CrashLoopBackOff with this Python traceback. Cause: the chart did not propagate global.required.database.host into <service>.envs.DATABASE_HOST, so the pod sees the literal string <to-fill> instead of mongodb. This was fixed in chart 1.2.7 — confirm you are not running an older artifact and that kubectl get deploy fastapi -o yaml | grep -A1 DATABASE_HOST shows value: mongodb (or whatever you set in step 9).
MongoDB Authentication failed (code 18)
The DATABASE_PASSWORD in the plexicus-fastapi Secret does not match the auth.rootPassword you supplied to helm install mongodb. Recreate the Secret with the correct password and kubectl rollout restart deploy -n plexicus.
Frontend ingress returns 503
Check kubectl describe pod -l app.kubernetes.io/name=frontend -n plexicus | grep "Startup:". The probe path must be /, not /health (Nuxt does not expose a /health route). Chart 1.2.7+ ships the correct path; older artifacts had /health and need to be repackaged. If you packaged the chart yourself, ensure your build did not reuse a stale charts/frontend-*.tgz from a previous package.
Browser refuses to load https://plexicus.local
The chart uses self-signed certificates by design. On Chrome, type thisisunsafe directly on the warning page to bypass it. For Safari and Firefox, click "Advanced → Proceed".
Login page shows skeleton placeholders forever
Symptom: opening /login shows the title and the OAuth buttons, but the email + password fields render as grey "animate-pulse" pill shapes that never resolve. Cause: Cloudflare Turnstile failed to initialise, usually because NUXT_PUBLIC_TURNSTILE_SITE_KEY is the literal <to-fill> placeholder. Browser console shows TurnstileError: Invalid input for parameter "sitekey", got "<to-fill>".
Fix: confirm chart 1.2.7+ is installed (it defaults the sitekey to Cloudflare's "always passes" test token), or override global.required.turnstile.siteKey and secretKey in your values overlay to the test tokens shown in step 9 — or to your real Cloudflare keys for production.
Turnstile validation failed, Please try again after Login
Symptom: filling in the form and clicking Login shows the inline error banner "Turnstile validation failed". Frontend Nuxt logs show FetchError: [POST] "https://challenges.cloudflare.com/turnstile/v0/siteverify": 400 Bad Request, error-codes: ['invalid-input-secret']. Cause: the server-side NUXT_TURNSTILE_SECRET_KEY is unset or stuck at <to-fill>. Fix: same as above — set global.required.turnstile.secretKey to the matching test secret (1x0000000000000000000000000000000AA) for eval, or to your real Cloudflare secret for production. Restart the frontend deployment after updating the values.
400 Disallowed CORS origin from API after login
Symptom: the SPA can't talk to api.plexicus.local. curl -i -X OPTIONS -H "Origin: https://plexicus.local" .../login returns 400 Disallowed CORS origin. Cause: FastAPI reads CORS_ORIGINS at startup and https://plexicus.local is not in the allow-list (or the env is empty). Fix: chart 1.2.7+ defaults CORS_ORIGINS to <scheme>://<domain>,<scheme>://api.<domain>. If you're on an older artifact, kubectl -n plexicus set env deploy/fastapi CORS_ORIGINS=https://plexicus.local,https://api.plexicus.local and restart the FastAPI rollout.
Login returns HTTP 500 "Namespace default is not found"
Temporal is running but the default namespace was never registered. This step was missed (or Temporal wasn't fully ready when step 7's registration command ran). Re-run it:
kubectl -n plexicus exec deploy/temporal-admintools -- \
  tctl --address temporal-frontend:7233 namespace register default
Then retry the login request.
Scan stays at "Scanning in progress" forever
Symptom: the Sandbox flow reaches "Scanning in progress" and the modal "Scanning taking longer than expected" appears after 15 minutes. Worker logs show openai.OpenAIError: The api_key client option must be set either by passing api_key to the client or by setting the OPENAI_API_KEY environment variable. Cause: the worker's existingSecret (plexicus-worker) is missing OPENAI_API_KEY. Fix: add it (kubectl -n plexicus patch secret plexicus-worker --type=json -p='[{"op":"add","path":"/data/OPENAI_API_KEY","value":"<base64-of-your-deepseek-or-openai-key>"}]') and restart the worker. Chart 1.2.7+ wires the matching non-secret env vars (OPENAI_BASE_URL, OPENAI_DEPLOYMENT_NAME, OPENAI_VERSION) automatically.